
")
SutterPatch®

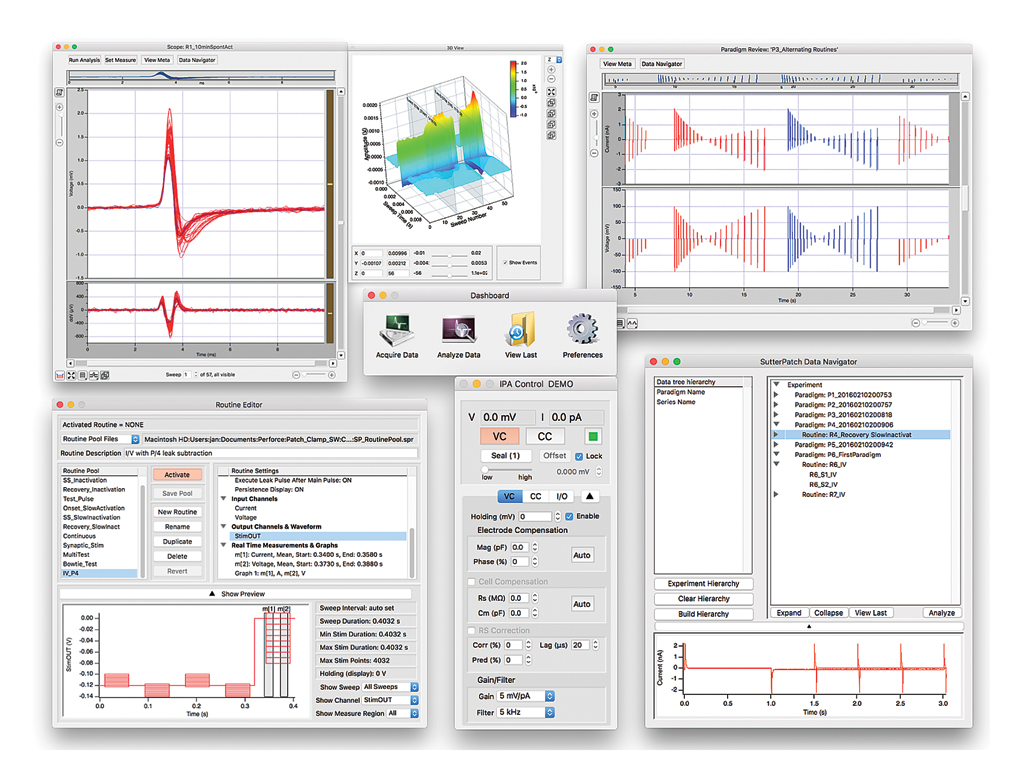

SutterPatch® software is a full-featured electrophysiology data acquisition, management and analysis application for Windows or Mac OS computers. SutterPatch comes bundled with all Sutter Instrument Patch Clamp Amplifier Systems. The software controls data acquisition, provides real-time measurements to aid decision making during the experiment, keeps track of all amplifier parameters, records the experimental progress and stores a set of up to 600 metadata parameters. Built within the latest version of Igor Pro by WaveMetrics, Inc., SutterPatch provides immediate access to Igor’s powerful scientific and engineering analysis tools.
Version 2 of SutterPatch software adds support for the new dPatch® Digital Patch Amplifier System as well as a multitude of new features and user interface improvements that also apply to the IPA Family of Amplifier Systems. The Membrane Test and Free Run have been upgraded. New triple slider and 2D-matrix controls facilitate compensation adjustments in the Amplifier Control Panel.
Particular emphasis was put into intuitive navigation through large data sets. Controls that are familiar from electrophysiology software or applications in other fields, as well as entirely new approaches make finding a particular section of an experiment very easy.
The structured architecture of the data files was designed to retain the context of every sample within an experiment. With little effort at the beginning of an experiment, a plethora of metadata parameters are recorded – automatically where possible, configured by the user where desired. Each parameter can be reviewed before a Paradigm or Routine is executed.
SutterPatch software comes with a collection of sample Paradigms and Routines that facilitate the configuring of commonly executed experimental scenarios.
SutterPatch provides real-time analysis capability that automatically creates graphs like I-V curves or a time course plot while the experiment is in progress. Up to 8 analysis graphs can be shown, each derived from 16 possible measurements from the input signals. Analyses include mean, slope, rise time, frequency of threshold crossing, etc. This facilitates making decisions about the further course of an experiment.
In addition to real-time analysis, SutterPatch supports further processing after the experiment for the most sophisticated analysis procedures. SutterPatch adds application-specific capabilities on top of the expansive analysis feature set that is native to Igor Pro. Equations and Variables facilitate the use of more complex algorithms in both Routines and Paradigms.
Features
- Support for for all Sutter Instrument Amplifier Systems, including the new dPatch® Digital Patch Clamp Recording System
- Dynamic Clamping with the dPATCH® Digital Patch Clamp Amplifier
- Scope Window provides intuitive, efficient navigation through your data
- Zoom control buttons and sliders
- Drag along axis to zoom in
- Mouse wheel zoom
- Marquee zoom
- Scroll bars
- Continuous and snapshot autoscale
- Sweep, time course and concatenated display
- Novel 3D display
- Unique Overview Navigator for panormaic examination of and convenient movement within a data section
- Paradigm Review window gives quick access to individual Routine Data
- Membrane Test keeps track of cell health and other quality control parameters
- Waveform types include double pulses, sine and triangle trains and instantaneous RMS noise measurement
- Simultaneous display of up to two amplifier or auxiliary input signals and a command waveform
- Test pulse parameters fully configurable
- Pulse averaging
- Audio monitor
- Routines control data acquisition with or without application of command waveforms
- Sample Routine Pool with pre-configured Paradigms for many common applications
- Hard-wired signals from Sutter Instrument hardware and auxiliary input signals are recorded
- The command signal as applied to the cell is monitored and recorded
- Analog and digital output signals control periphery and third-party information
- Up to 50 Segments per Sweep for utmost flexibility in shaping the most complex command waveforms
- Preconfigured Segment shapes such as Sine, Square, and Chirp for easy waveform design
- Waveform Template enables “playback” of a recorded signal to a cell or applying a mathmatical expression as a waveform
- Measurements provide the basis for real-time analysis and enable decision making in the course of the experiment
- Paradigms enable process automation and eliminate operator bias
- Sample Paradigm Pool with pre-configured Paradigms for many common applications
- Configure the amplifier to reproducible standard settings
- Acquisition of Routine sequences enables pre-planned experimentation and minimizes operator bias
- Flow control for interactive or automated decision-making during the experiment
- Chaining Paradigms provides added flexibility
- Automatic creation of Layouts for standardized documentation
- The Solution Editor lets you keep track of solutions and compounds and supports direct control of a solution switcher
- Initial conditions and all solution changes are automatically written to the MetaData
- Analog or digital outputs control all common solution switchers
- The Data Navigator displays the entire experiment in a tree structure
- Preview of the first acquired signal
- Quick access to Paradigm Review, Reanalysis Scope, Metadata and Routine information
- Real-time and off-line analyses, including mini / synaptic event detection and action potential characterization
- Measurements configured as part of Routines create real-time graphs
- Virtual signals provide the user with information derived from physical input signals, mathematical equations, signal modification, or any combination thereof. High- and low-pass filters, lock-in amplifier capability, and subtraction of a reference sweep are new in version 2
- Paradigms can access measurements for further real-time analysis
- Equations and variables provide utmost flexibility
- Event detection using a performant, deconvolution-based algorithm
- Easily exports data to Microsoft Excel and other spreadsheet programs for compatibility with existing analysis procedures
- A wealth of native Igor Pro analysis features
- Support for IPA multi-amplifier mode
- A combination of any two IPA® or Double IPA® Amplifiers can be connected
- Up to 16 input channels are supported
System Requirements
for the IPA family systems
Minimum Configuration:
Operating System: Windows 10 (64-bit) or later, or MacOS: 10.11, El Capitan or later
Processor: Dual-core i5
Memory: 3 GB
Hard Disk: 500 GB or greater
Display Resolution: 1024 × 768 (XGA)
1 available USB 2.0 High Speed port
Recommended Configuration:
Windows 10 (64-bit) or later, or MacOS: 10.11, El Capitan or later
Processor: Dual-core i5
Memory: 8 GB
Solid-state drive (SSD): 500 GB or greater
Display Resolution: 1920 × 1080 (FULL HD)
1 available USB 2.0 High Speed port
for dPatch systems
Minimum Configuration:
Windows 10 (64-bit), or MacOS: 10.11, El Capitan or later
Processor: Dual-core i5
Memory: 6 GB
Solid-state drive (SSD): 500 GB or greater
Display Resolution: 1024 x 768 (XGA)
1 available USB 3.0 SuperSpeed port (on the main board, not a PCIx card or similar)
Recommended Configuration:
Windows 10 (64-bit), or MacOS: 10.11, El Capitan or later
Processor: Dual-core i5
Memory: 16 GB
Solid-state drive (SSD): 500 GB or greater
Display resolution 1920 x 1080 (Full HD)
1 available USB 3.0 SuperSpeed port (on the main board, not a PCIx card or similar)
SUTTERPATCH® Data Acquisition Management System and Analysis Software: Included with all Sutter Instrument Amplifier Systems
Notes:
USB 3.0 ports are compatible with USB 2.0 High Speed specifications.
Slower USB 2.0 ‘full-speed’ ports, which are sometimes found on older Windows PCs or USB add-in cards, are not supported.
To check for High Speed USB 2.0 or USB 3.0 on a PC computer running Windows, look in the Control Panel > Device Manager > Universal Serial Bus controllers section for “Enhanced” host controllers. As this does not provide any mapping information to the computer’s physical ports, and there can be a mix of USB port versions, you should check individual USB ports for USB 2.0/3.0 High Speed operational performance. As a visual indicator, USB 3.0 ports are often color coded blue.
USB hubs are not supported. USB add-in cards, even if they formally meet High Speed or Super Speed specifications, are not recommended. They are often architecturally configured as USB hubs and may lead to intermittent transfer errors that are hard to troubleshoot.
Operating systems installed within virtualization software platforms such as VMware and Parallels are not supported.
Information about environmental parameters and a more detailed specification of sample properties can be recorded and stored with the raw data. A total of over 600 metadata attributes are supported. Examples include: animal species, genotype, date/time when a cell sample was prepared, recording solutions, pipette resistance, hardware properties, and detailed information about stimuli applied.
Also See:
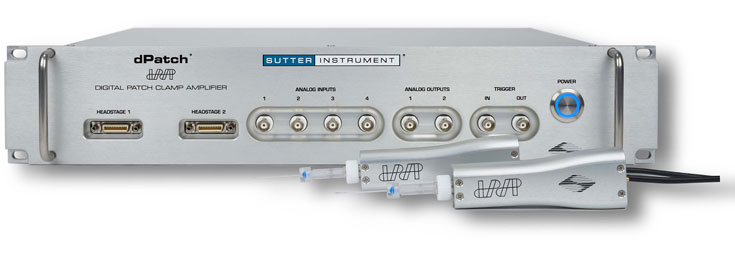
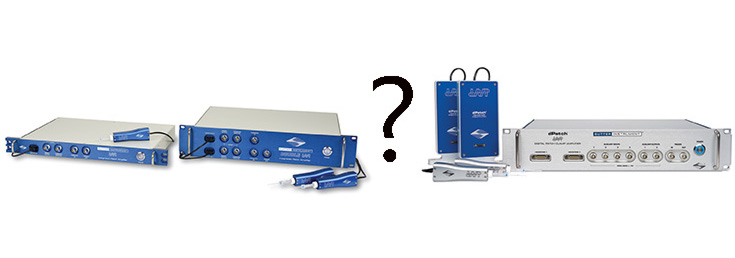
dPatch®
Low-Noise Ultra-fast
Digital Patch Clamp Amplifier System
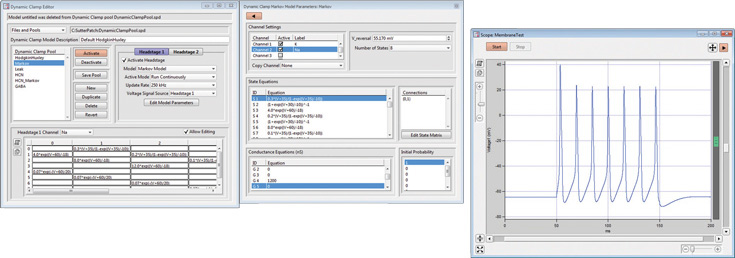
Dynamic Clamp
for the
dPATCH® Patch Clamp Amplifier
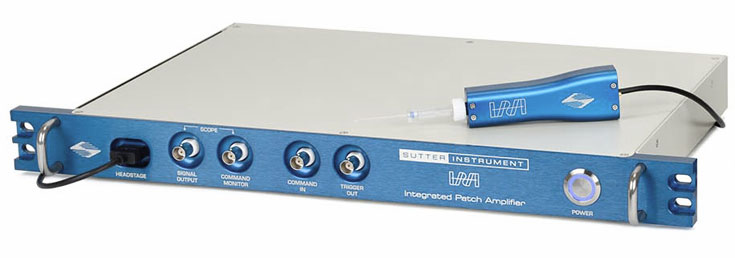
IPA® / DOUBLE IPA®
Integrated Patch Clamp
Amplifier System
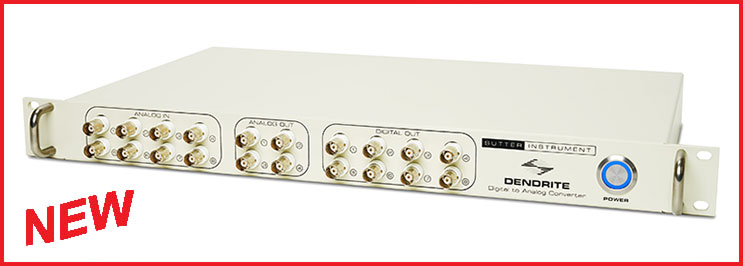
Dendrite ™
Data Acquisition,
Management and Analysis System
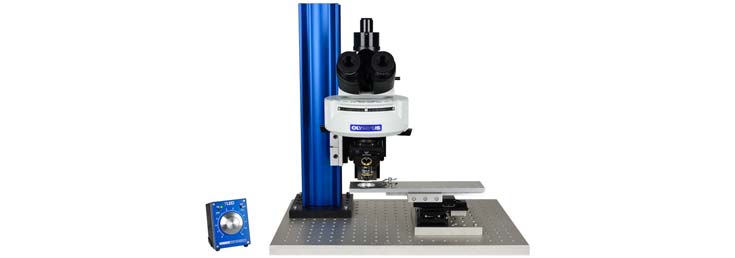
BOB
Well suited microscope
for the electrophysiological setup
Comparison of IPA with dPatch
(PDF file)
![]()
IPA Publications
(PDF file, external link)